Triangulation and analysis of behavioral videos
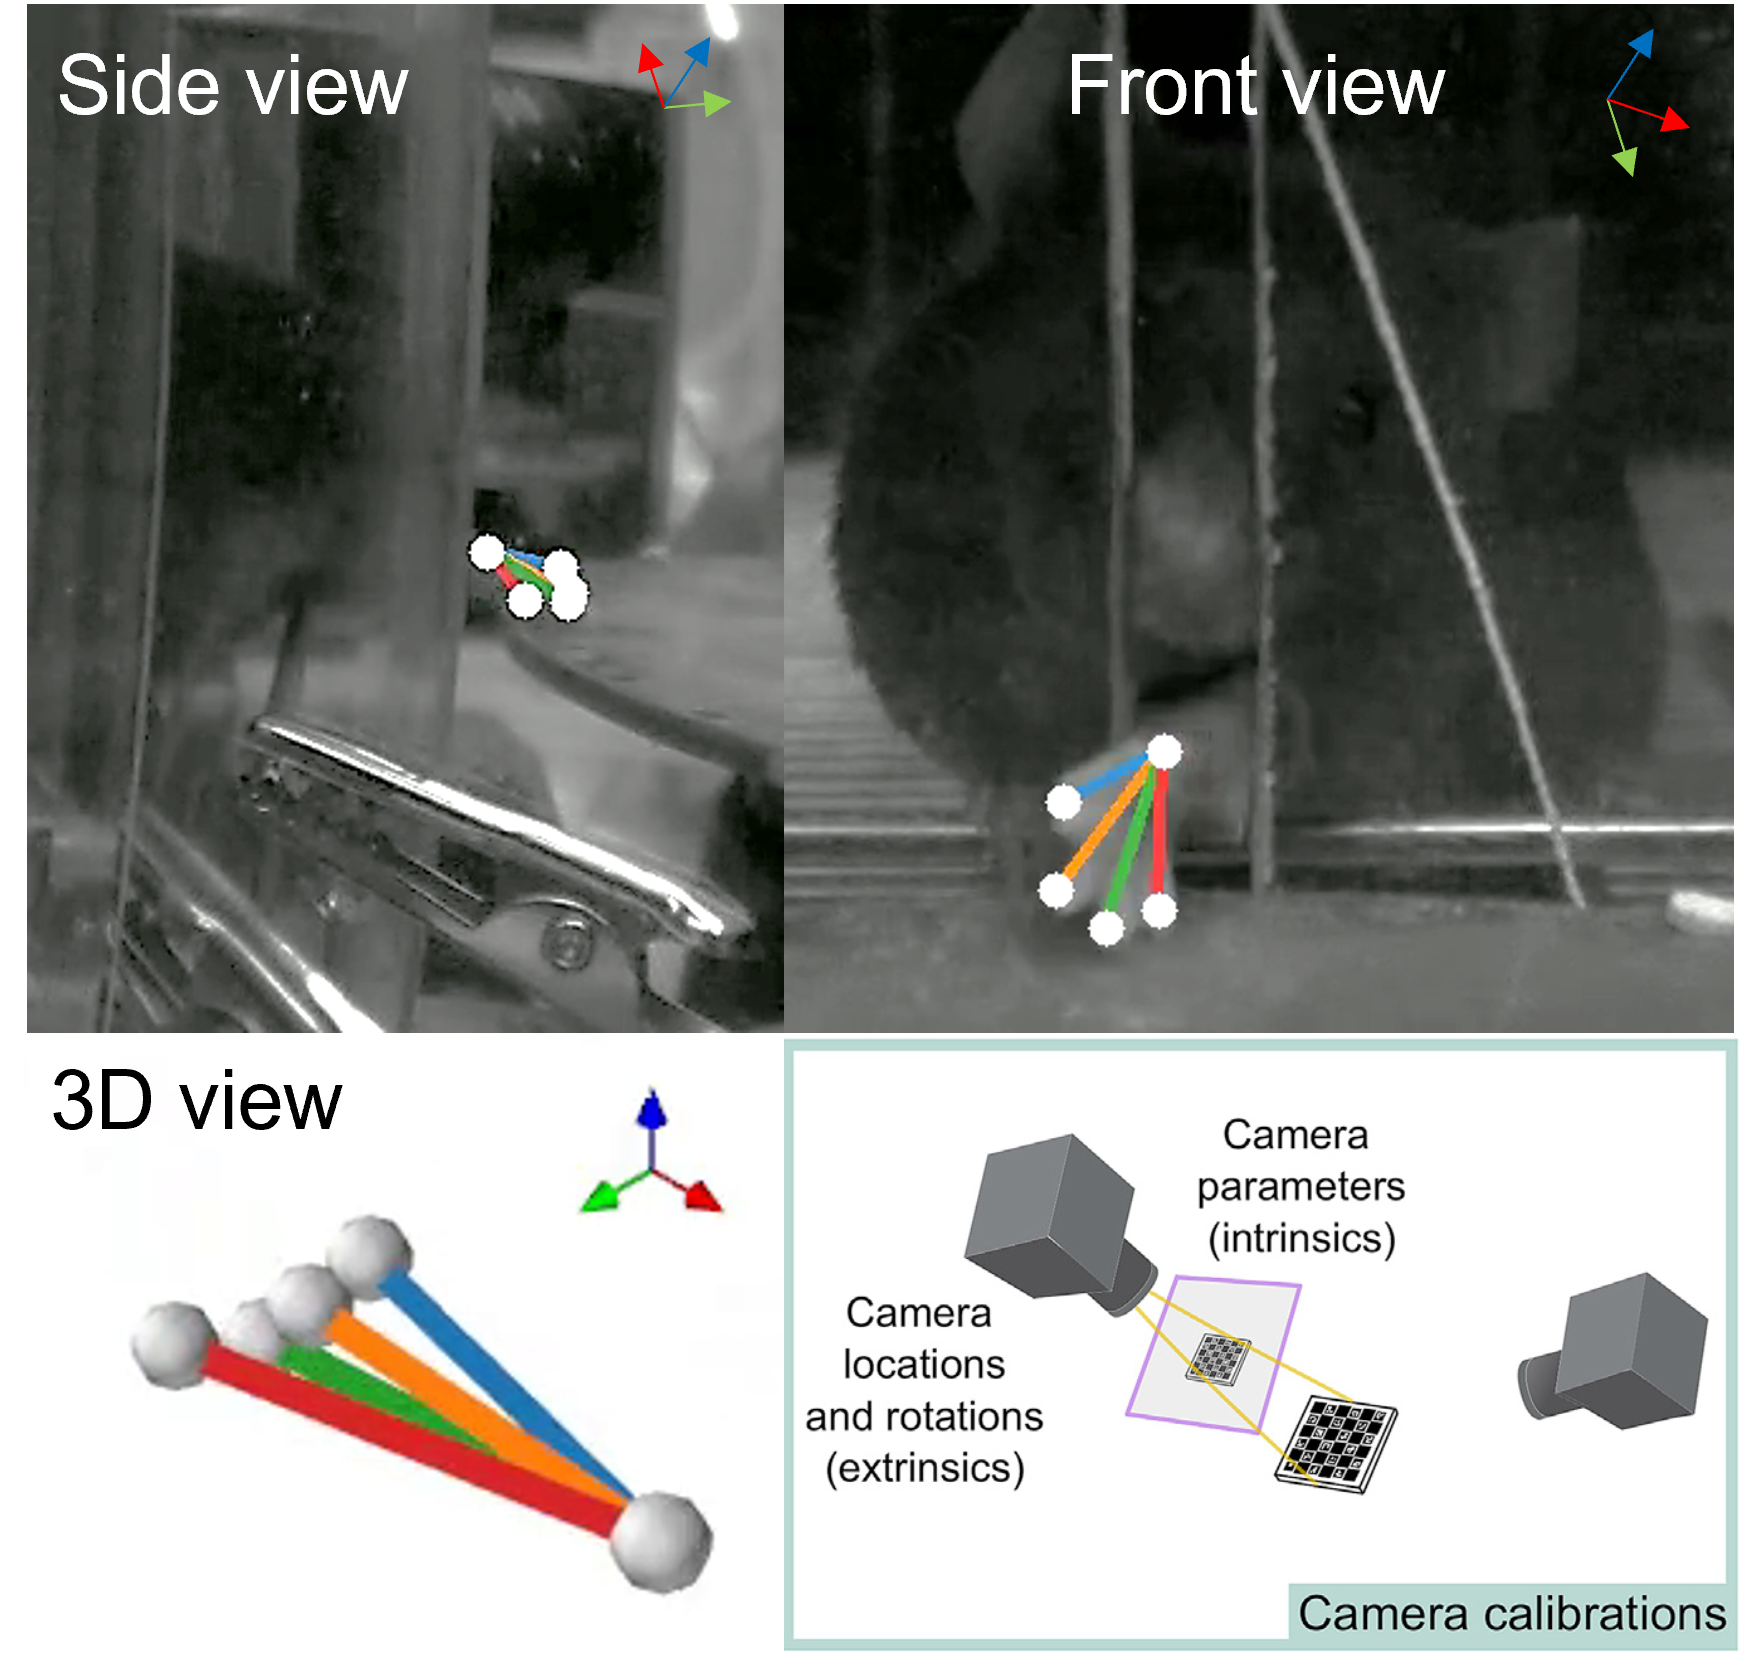
In addition to the hardware part, we provide the complementary software data analysis pipeline which can be performed off-line with the acquired videos. Python package for the 3d trajectory reconstruction and kinematic analysis is organized in classes and modules implemented in a series of Jupyter Notebooks and based on the state-of-the-art solutions for the markerless pose estimation as well as original code
- DeepLabCut is used for intial tracking using pretrained ResNet architecture (& training it).
- Anipose Lib is used for the 3d triangulation part to restore the action in absolute coordinates (mm).
- ReachOut is our humble code contribution and is used for all the analysis on kinematic traces.
ReachOut kinematic analysis pipeline
The ReachOut pipeline can be used separately on your own videos and guides the user through the number of steps to extract the parts from the video, track and triangulate the points of interest (paw, fingers), cluster the reaches, visualize and compare basic kinematic parameters for different reaching categories. User has the ability to export the final data on the kinematics (scalars for each reach) and reaching timestamps as a *.h5/.csv table for further analysis or synchronization with his own pipeline.
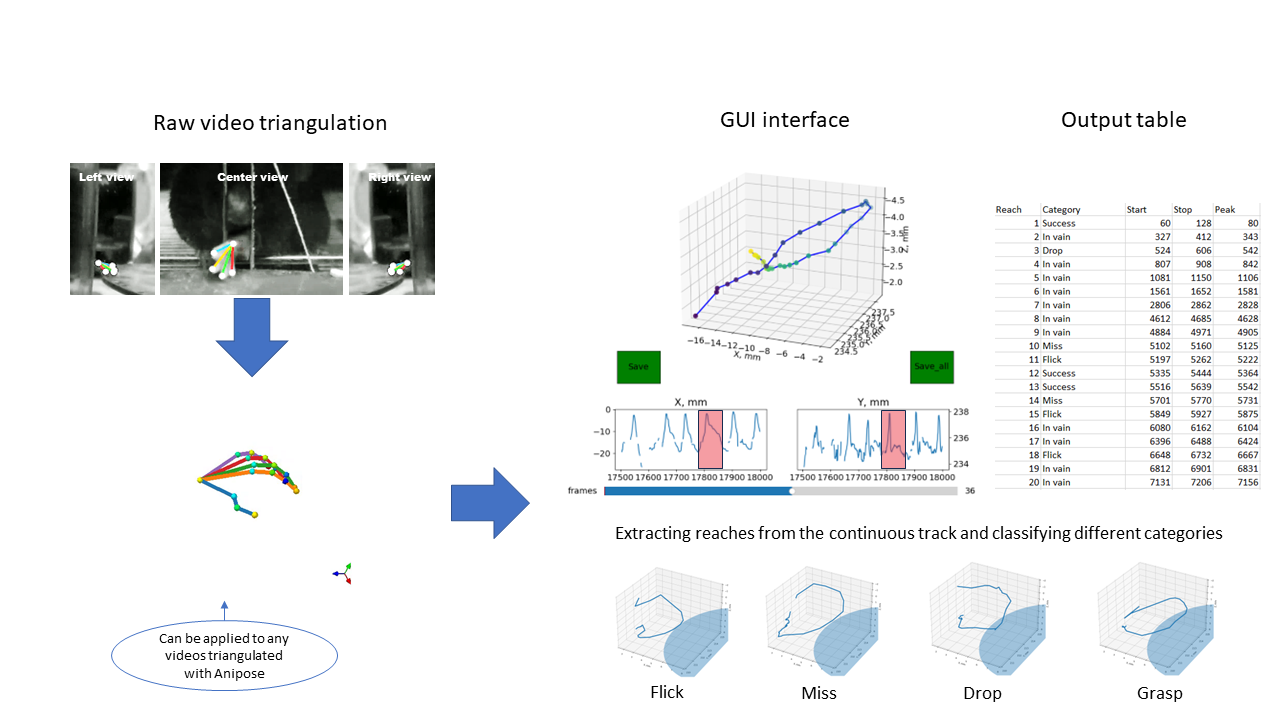
Analysis pipeline consists of extracting the parts from the video, tracking and triangulating the points of interest (paw, fingers), clustering the reaches, visualizing and comparing basic kinematic parameters between different reaching categories. We suggest copying the whole folder
- 2D pipeline or
- 3D pipeline
from the Analysis Toolbox, nd then running the Notebooks using Jupyter
> cd path\to\the scripts\
> conda activate DEEPLABCUT
> jupyter notebook
Using ReachOut analysis pipeline
There are two pipelines provided - one for 3d analysis and reconstruction, and a simpler 2d one, working with only one video (single camera view). We mention the differences in the following sections and suggest to start with a simpler one if your experiment doesn’t specfically require triangulation and representation of coordinates in absolute space (in mm).
The Notebooks are split by their function: ReachOut - Tracking guides the user throught the necessary steps for tracking the points of interest
- Cutting the video acquired with FLIR camera into three parts - specific for our setup with two mirrors
- Opening the DeepLabCut interface window and running through the full pipeline to track the points of interest
- Updating the csv output from DeepLabCut with absolute position for our reference points
- Using the code from Anipose lib and preprecorded calibration videos to triangulate the points - specific for our setup with two mirrors

Here are the main steps as described in the Notebooks
ReachOut - Tracking
**Provides all the scripts to process the behavioral videos and get to the .csv file with **
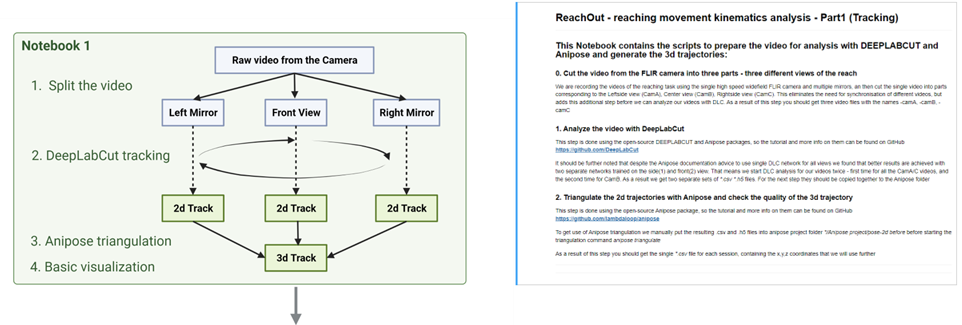
- Cut the video from the FLIR camera into three parts - three different views of the reach
We are recording the videos of the reaching task using the single high speed widefield FLIR camera and multiple mirrors. So the first part is to cut single video into parts corresponding to the Rightside view (CamA), Center view (CamB), Leftside view (CamC) with respect to the animal paw. This eliminates the need for synchronisation of different videos, but adds this additional step before we can analyze our videos with DLC. As a result of this step you should get three video files with the names -camA, -camB, -camC
- Analyze the video with DeepLabCut
This step is performed using open-source DeepLabCut package, the tutorial and more info on which can be found on GitHub. In short, the first command should launch DeepLabCut interface which guides you through creating the network, training dataset from your videos (selecting subset of frames and manually labeling the points of interest), training & evaluating the network and finally applying it to all your videos. The final output should be a .csv file for each video with coordinates (in pixel dimensions) for all the points tracked by the network. We added some code to open, check this table and insert necessary columns with static points for triangulation.
It should be further noted that despite the Anipose documentation advice to use single DLC network for all views we found that better results are achieved with two separate networks trained on the side(1) and front(2) view. That means we start DLC analysis for our videos twice - first time for all the CamA/C videos, and the second time for CamB. As a result we get two separate sets of *.csv *.h5 files. For the next step they should have the same name with the difference of last prefix “A,B,C” and copied together to one folder accessible by this Notebook. Not needed if using simpler 2D pipeline without triangulation
- Triangulate the 2d trajectories with Anipose and check the quality of the 3d trajectory
This step is done using the open-source Anipose package, so the tutorial and more info on them can be found on GitHub Here we provide the code snippet (from Anipose Lib) to calibrate the camera intrinsics using prerecorded videos or checkerboard pattern and use the resulting calibration.toml file to triangulate coordinates for the paw in absolute space.
If you want to use Anipose interface for triangulation you should manually put the resulting .csv and .h5 files into anipose project folder */Anipose project/pose-2d before before starting the triangulation command anipose triangulate
As a result of this step you should get the single *.csv file for each session, containing absolute x,y,z coordinates, that we will use further
Not needed if using simpler 2D pipeline without triangulation
ReachOut - Analysis
Provides multiple gui snippets to manually segment and annotate the results from DeepLabCut

- Manually scroll through DeepLabCut tracking coordinates, plot them and choose the segments for kinematic analysis (reaches in our case)
- Load the selected parts of the trajectory and manually annotate them from watching the corresponding parts of the video (we defined different reaching categories)
- Open the .csv file, scroll through the trajectories and manually choose the fragments of the trajectory (with the reaches) for analysis
This script will ask you to choose a file with the OpenFile interface. Point it to the *.csv file generated by the previous notebook. It will open the GUI to review the 2d trajectory with time used as a 3rd dimension and extract the fragments of the trajectory for further analysis. As a result of this step you will have the *.h5 file with the fragments of the trajectory that you’ve chosen. Open this file to review the trajectories.
Small video showing the workflow
In cotrast to the standard 3D pipeline (tracking_split), 2D relies on the different script (tracking_split_2d), all other steps are the same, but with the time substituting Z-dimension in the 3D plot, that way you basically see the change in 2d trajectory with time.
- Open the h5 file and the corresponding video to review and classify the trajectories
This script is made to load the selected parts of the trajectory and manually annotate them from watching the corresponding parts of the video. For this script to work point it to the *.h5 file you want to analyze (file) and the video corresponding to the same session (file2.mp4) and then use the GUI to rewatch the video fragments and manually assign the labels. As a result of this step you will have the *scalars.h5 file which is used in the vizualisation steps 5 and 6.
ReachOut - Visualization
Provides the user with multiple ways to visualize the data and kinematic parameters

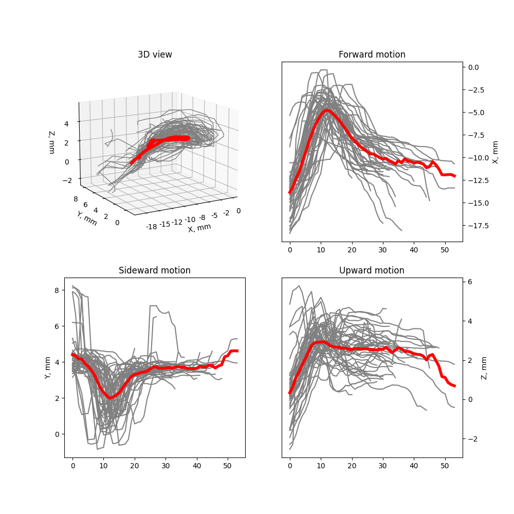
- Look at superimposed trajectories for the chosen category of action - reaches in our case
- Look at the violin plots for different kinematic parameters for the chosen category of action
- Cluster the actions based on the chosen set of parameters
- Open the scalars.h5 file and plot all the trajectories of the chosen category
This snippet shows all reaches in the chosen category as Timeseries for visual inspection and analysis. From the lists you can choose the category of reaches and the type of data to plot.
- Open the scalars.h5 file and make violin plots for the chosen parameters and reach categories
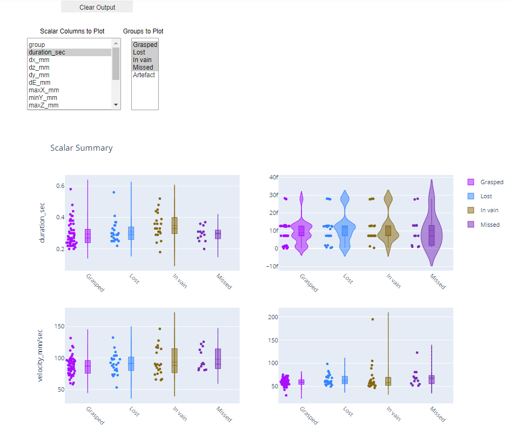
-
Open the scalars.h5 file and automatically cluster the reaches using one of the built in methods
-
Show the number of reaches in each category
Q&A
If you still have questions after reading this and STAR Protocols please let us know and we list it in this section.